AI Agent Dashboard
An AI agent dashboard your customers can actually see
A good AI agent dashboard answers one question at a glance: is the agent doing its job? That means three things visible without a click: whether each agent is running or stuck right now, what it's costing per resolved task, and whether its output actually resolved anything. Most dashboards on the market answer that for your own team and stop there. If you're shipping an AI agent inside a product other companies pay for, your customers want that same view, scoped to just their own data.
What it shows
Three camps of AI agent dashboard, and what each one is missing
Look at what AI agent dashboards actually ship today and a pattern shows up fast. Operational dashboards built for managing a fleet of agents track status, active tasks, and a chat log with the agent itself, useful for keeping tabs on what's running, thin on whether any of it paid off. Observability-style dashboards, the kind built on top of a tracing platform, lean the other way: deep trace inspection and cost breakdowns for engineers, with little translation into a number a non-technical stakeholder would trust. Support-tool dashboards, the kind built into a helpdesk product, report a resolution percentage and an escalation percentage, but only to the business running the tool, never further down to that business's own customers.
None of that is wrong on its own. A dashboard needs the trace data underneath it to mean anything, and getting that tracing right is its own discipline. But a dashboard is a different artifact from a trace viewer. A trace viewer answers "what happened on this one run". A dashboard answers "is the agent working, in aggregate, right now", and if you're building a product other companies pay for, it has to answer that for two audiences at once: your own team, and their own customers.
Table stakes
The six panels every AI agent dashboard needs
Cover these and you match what any AI agent dashboard on the market gives you, before you add the customer-facing layer below.
Status and activity
A live read on whether each agent is idle, actively working, or stuck, so a stall shows up before a customer has to report it.
Cost per run
Model calls plus infrastructure, attributed to the specific run and customer that generated it, not just a monthly total on an invoice.
Resolution and escalation
The share of runs that finished the job versus the share handed to a human, the two numbers a support or sales leader actually cares about.
Latency, tail not average
The p95 and p99, not the mean. A run that's fast nineteen times out of twenty and stalls on the twentieth is the one that generates a complaint.
Failure type
Timeouts, tool errors, and empty results, broken out separately instead of folded into one undifferentiated error count, because the fix for each is different.
Access and audit trail
A record of what each agent read or wrote and who can see which customer's data, especially once agents get write access to real systems.
What most dashboards skip
Every dashboard on the market is built for your team, not your customers
Search for an AI agent dashboard today and the results split into three camps, and none of them is built to hand to your own customers. A control-panel product like AgentCenter tracks agent status, task assignment, and a chat log, solid for a team running a fleet of agents day to day, but there's no white-labeling, no multi-tenant option, and no ROI number anywhere on the page. A guide comparing ten observability and tracing platforms, LangSmith, Langfuse, Helicone, and others among them, judges them on unified interfaces and cost visibility, and never once mentions white-label or multi-tenant deployment either. Zendesk's own AI agents dashboard reports total conversations, an automated resolution percentage, and an escalation percentage, exactly the kind of number a customer would want, but it stops at the business running Zendesk. There's no way to hand that same view, scoped to just their own data, to that business's own customers.
That gap is architectural, not cosmetic. Showing agent performance to your own engineers and showing it to your customer's finance team are different problems. The first needs depth: full traces, every tool call, every retry. The second needs trust: a small number of clearly defined metrics, deflection rate, cost per resolution, resolution rate, that a customer can check against their own experience, with zero chance of seeing another customer's data mixed in.
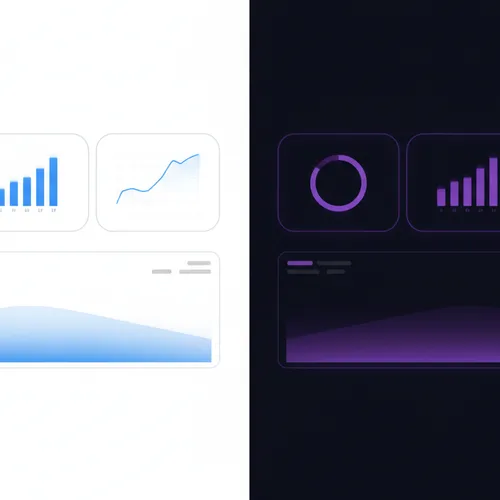
AiAgRe scopes every event to an org and a customer identity the moment it's ingested, through a Node SDK with LangChain, LlamaIndex, and CrewAI integrations, so isolation is built into the write path instead of bolted onto a shared table with a filter. The dashboard itself ships as white-label React components your engineers drop into your own product, styled to match your product's design instead of asking a customer to log into a separately branded portal. Each customer's embed token reads only their own numbers.
Build vs. buy
Three ways to get an AI agent dashboard
Each option trades off differently between control, speed, and whether it's ready to show a paying customer.
Build it yourself
Grafana, Retool, or a hand-rolled internal tool wired to your own database. Full control over every chart, and full ownership of every tenant-scoping bug, for as long as the product exists.
Buy an observability platform
A tracing tool built for your own engineering team gets you deep debugging fast. Handing that same view to a paying customer usually means building a second, simplified UI on top of it anyway.
Embed a white-label dashboard
KPI panels that ship pre-scoped to org and customer, dropped into your product as components instead of a second app. Your team skips building the customer-facing layer from zero.
How the numbers get calculated
The three formulas behind every panel on the dashboard
A dashboard is only trustworthy if the formula behind each number is one you'd stand behind if a customer asked you to explain it. Deflection rate is resolved-without-a-human contacts divided by total contacts, and the honest version counts a conversation as escalated the moment a human enters the loop, not the moment they finish reviewing it, so a drafted-then-approved reply doesn't quietly count as deflected. Cost per resolution is total cost, model calls plus infrastructure plus any reviewer time on escalated runs, divided by the number of contacts actually resolved, not the number attempted; a run that fails and gets retried three times before succeeding should carry all three attempts' cost in that one resolution, not just the last one. Resolution rate is close to deflection rate but broader: it counts every contact the agent closed out correctly, whether a human touched it or not, so it's the number that answers "did this get solved" while deflection rate answers "did this get solved without costing us a person's time."
Get these three definitions locked and documented before you wire up the dashboard, not after. A customer who catches your dashboard quietly redefining "resolved" between two billing periods loses trust in every other number on the page, even the ones that were always accurate.
FAQs
AI agent dashboard: frequently asked questions
Common questions from teams deciding how to build or buy an AI agent dashboard for a customer-facing product.
What should an AI agent dashboard show?
At minimum, four numbers: whether each agent is active or stuck right now, cost per run, resolution rate, and p95 latency instead of the average. Anything past that, deep trace detail, custom alert rules, is a feature built on top of the dashboard, not the dashboard itself.
Should I build my own AI agent dashboard or buy one?
Build it if the dashboard only needs to serve your own engineering team and you already run a tool like Grafana or Retool. Buy or embed one if you need to hand a trustworthy, isolated view to your own paying customers, since that's the part almost nothing off the shelf covers well.
Can an AI agent dashboard be white-labeled?
Yes, if the underlying components are built to be embedded rather than viewed on a vendor's own site. AiAgRe's dashboard ships as React components your team styles to match your product, instead of sending customers to a separately branded portal.
How do you keep one customer's data out of another customer's AI agent dashboard?
Tag every event with both an org identity and a customer identity the moment it's captured, then scope every read the same way. A dashboard that filters a shared table after the fact, instead of scoping at ingestion, is one bug away from showing customer A a trace that belongs to customer B. See multi-tenant analytics for the full pattern.
Do tools like LangSmith or Langfuse work as a customer-facing AI agent dashboard?
They're built to help your own engineers debug traces, and they do that well. None of the major observability platforms are built for multi-tenant, white-labeled, customer-facing deployment, so teams that need one usually end up building a second, simplified dashboard for customers anyway.
What is an embeddable AI agent dashboard?
A set of dashboard components, usually React, that a team drops directly into their own product instead of sending customers to a separate vendor site. The KPI data behind it is scoped per customer from the start, so each customer's embed only ever reads their own numbers.
Ready to show your dashboard to your customers?
Request access and we'll help you scope your first customer-facing embed.