· Prakash Natarajan · Reliability · 17 min read
AI Agent Observability: What to Trace First
AI agent observability means tracing every tool call and model call, then turning those traces into numbers your own customers can see, tenant by tenant.
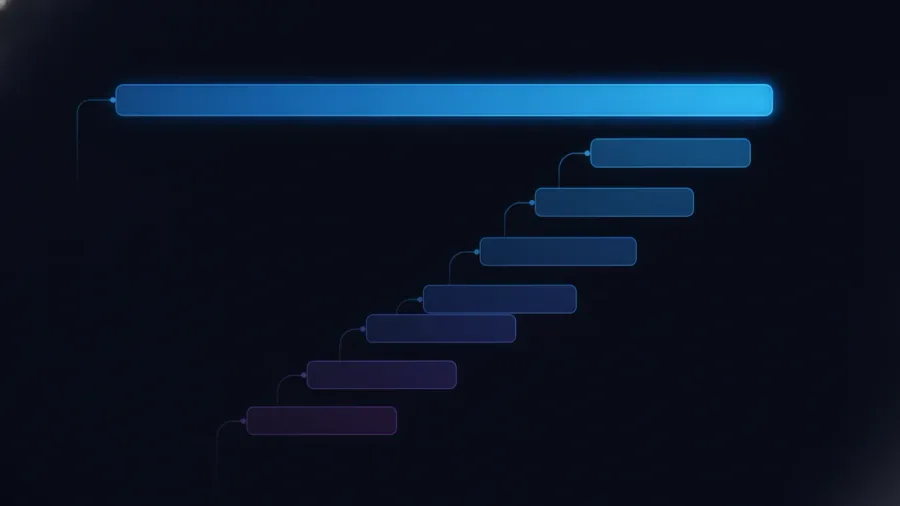
AI agent observability means capturing an ordered, inspectable record of everything an agent does in production: every model call, every tool invocation, every piece of retrieved context, organized into traces and spans instead of a single pass-or-fail transcript. It matters because an agent can read as correct in a quick glance at the final reply and still have called the wrong tool, burned a dozen extra reasoning steps, or lost track of something the user already said two turns earlier. Most guides on this topic stop at the engineering side of the problem: what to instrument, which metrics to track, which dashboard to buy. The harder half, and the one almost nothing written about this covers, is turning that same trace into a number a paying customer can actually see, scoped to their own account, with a clear rule for when it should actually trigger an alert, and this piece covers both halves.
What is AI agent observability, exactly?
AI agent observability is the practice of instrumenting an agent so every step behind a reply gets recorded as a trace, a complete record of one agent run from the first message to the final action, broken into spans: the individual model calls, tool calls, and retrieval steps that happened inside it.
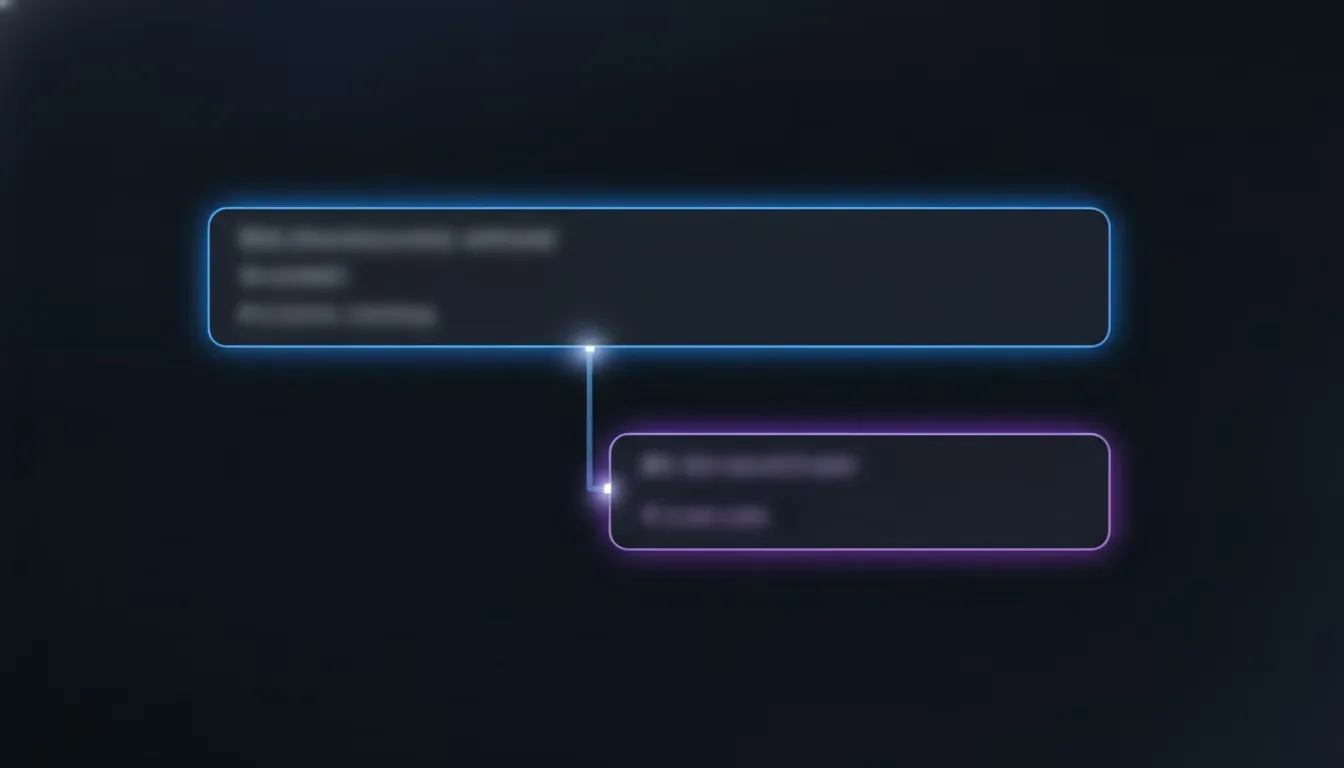
The vocabulary comes straight from software observability more generally, where a trace follows one request through a distributed system and a span marks one unit of work inside that trip. Agent frameworks borrowed the same terms because an agent making four tool calls and four model calls to answer one question is, structurally, the same kind of distributed request, just running inside one process instead of across several services. The standard most teams build instrumentation on top of is OpenTelemetry, an open, vendor-neutral specification for capturing traces and spans, and adopting it early matters because it keeps your instrumentation from locking you into whichever tracing backend you happen to pick first.
What actually separates observability from plain logging is the shape of the record, not the amount of data collected. A log line tells you a tool was called. A trace tells you which model call triggered that tool, what arguments it received, how long the call took, what it returned, and where that step sits inside the larger run, all connected in one queryable tree you can walk. That tree structure is what lets you answer the question a flat log never can: given one bad final answer, which exact step in the chain actually caused it. Teams that “have logging” but still can’t explain a specific agent failure without reading raw output line by line for twenty minutes are almost always missing this structure, not the data itself.
What should you actually trace in a production AI agent?
You should trace four things at minimum: every model call with its full prompt and response, every tool call with its arguments and return value, every piece of context the agent retrieved before answering, and the state it carried between turns.

Skipping any one of these leaves a blind spot in exactly the place agents tend to fail. A model call trace that only records the user’s message, rather than the full assembled prompt including instructions and retrieved context, makes it impossible to tell whether a bad answer came from the model itself or from what it was handed to read. A tool call trace without the exact arguments sent hides the classic near-miss failure: the agent picks the right tool but calls it with a slightly wrong parameter, gets back a technically valid response, and reports the result with the same confident tone it would use for a fully correct one.
Multi-turn and multi-agent runs need one more layer on top of this: a thread or session identifier that ties every trace from one conversation together, not just one isolated turn. A single customer conversation with a support copilot can span six separate agent turns, each producing its own trace, and a session id is the only thing that lets you reconstruct the conversation the way the customer actually experienced it, rather than as six disconnected fragments scattered across your trace store. Skip this and a failure that only shows up on the fourth turn, once earlier context has piled up, becomes close to impossible to reproduce from the trace data alone; see context rot in AI agents for why that specific turn-four failure keeps showing up even when nothing has technically fallen out of the model’s context window yet.
Which metrics actually tell you an agent is working?
Four numbers cover most of what matters day to day: latency per turn, cost per resolution, tool-call success rate, and task completion rate. The common mistake is tracking only the first two, because they’re the easiest to pull straight off a trace without any judgment calls.

Latency and cost are genuinely useful and genuinely simple: sum the time and the token spend across every span in a trace and you have both, per conversation, with no need to decide what “correct” even means. Tool-call success rate needs a bit more care, because a tool call can return without error and still have done the wrong thing, so a useful version of this metric checks the tool’s actual return value against what a correct call for that step should have produced, rather than just whether the call failed to error out.
Task completion rate is the hardest of the four, and the one most worth the extra effort, because it directly answers whether the agent did what the customer actually needed. Getting it right means deciding, concretely and per task type, what “completed” means: a support copilot closing a billing question completes differently than one escalating a bug report, and a single blanket completion metric spanning every task type usually ends up meaning nothing specific to whoever is reading it. The practical fix is defining completion criteria per task type up front and tying each one to a specific signal already sitting in the trace, a tool call that fired, a classifier that ran, an explicit user confirmation, rather than trying to infer completion after the fact from how confident the final reply sounds. That last trap has a name: AI agent hallucination covers the specific pattern where a reply narrates a completed action with no matching tool call in the trace, which a confidence-based completion check will always miss.
How do you turn a trace into a number your customer can see?
You turn a trace into a customer-facing number by defining the metric once, computing it from the same trace data your engineering dashboards already use, and rendering it scoped to one tenant’s traces only, instead of building a second reporting pipeline that recalculates things a different way.

This is the step almost every observability guide skips, because most of them are written for an internal engineering audience watching their own agent, not for a team whose own paying customers expect to see deflection rate, cost per resolution, and resolution rate on their own dashboard. The gap is not really a technical one, it’s a definitional one: if “resolved” means one thing in the trace-level classifier your engineers trust and something looser in whatever powers the customer-facing chart, the two numbers drift apart, and nobody can explain why a spot check of the raw conversations doesn’t match what the dashboard says.
The fix is computing the customer-facing metric directly from trace data, tagged with the tenant it belongs to at the point of capture, so the same event that feeds your internal debugging view also feeds that specific customer’s dashboard, filtered rather than recalculated from scratch. A conversation marked resolved because a specific tool call fired and a closing classifier confirmed it produces the same “resolved” whether an engineer is reading the raw trace or a customer is reading their monthly summary. That consistency is the entire trust story behind a deflection rate or cost-per-resolution figure: a customer who spot-checks three conversations against the number on their dashboard should get the same answer the trace data gives, every time, not most of the time.
How do you keep one customer’s failures out of another’s traces?
You keep one customer’s failures out of another’s traces by tagging tenant identity at the moment a trace is captured, not by filtering it out later in the display layer, because a filter applied after the fact only hides a leak, it doesn’t prevent one.

This distinction sounds small until you’ve watched it fail. A dashboard that queries every trace and then filters by tenant in application code will eventually show the wrong rows the moment that filter has a bug, while a system that tags and partitions data at write time simply has nothing else to query when a request scoped to one tenant runs. The second approach is harder to build up front and close to impossible to get wrong later, which is the trade worth making for anything customer-facing.
Test the boundary directly rather than trusting your access-control code to be correct on its own. Run your agent under two separate fake tenant identities, generate traces under both, then deliberately request one tenant’s data using credentials scoped to the other and confirm the request fails cleanly instead of silently returning the wrong rows. Run the same check against your aggregate metrics, not only individual traces: a resolution rate or cost figure computed across “all traces” instead of “this tenant’s traces” is a subtler version of the same leak, and it’s the harder one to notice, because the resulting number often still looks perfectly plausible on its own. This tagging-at-capture approach is the same one a multi-tenant analytics layer needs underneath it.
When should you actually alert, and on what threshold?
You should alert when a metric moves far enough from its own recent baseline to represent a real change in behavior, not at a single fixed number picked once in advance, because the right threshold for cost per resolution or tool-call error rate depends entirely on what’s normal for your specific agent and customer base.

A fixed threshold set once at launch either fires constantly as your agent’s normal operating range shifts with new features, or stops meaning anything once traffic patterns change enough that the original number no longer reflects a real problem. A more durable approach is a rolling baseline: track each metric’s typical range over the trailing one to two weeks and alert when a new reading moves a meaningful distance outside that range, sustained across enough conversations to rule out one noisy sample.
Pick a different sensitivity per metric rather than applying one rule everywhere. Tool-call error rate deserves a fast, tight alert, because a broken tool integration usually means every conversation touching that tool is failing right now, and catching it in minutes instead of hours has real, direct cost. Cost per resolution and task completion rate move more slowly and can tolerate a wider band and a longer observation window before alerting, since one bad batch of conversations shouldn’t page anyone at two in the morning. Route each alert to whoever can actually act on it: an engineering channel for a tool or model regression, and a separate, quieter digest for a customer-facing metric drift that a support or success team should know about before the customer asks.
Which observability tooling do you actually need?
Most teams need three layers working together: an instrumentation library that captures traces at the source, a store and query layer that lets you inspect and search them, and a reporting layer that turns the same data into numbers a customer or stakeholder actually looks at. The mistake is assuming one tool covers all three.

OpenTelemetry, or a framework-specific wrapper like the ones built into LangChain, LlamaIndex, and CrewAI, covers the first layer well and is worth adopting regardless of which backend you eventually choose, because switching instrumentation later means re-touching every integration point in your codebase. General observability platforms and purpose-built agent tracing tools cover the second layer, giving your engineering team a searchable view into raw traces, span-level timing, and error rates, which is exactly the audience most of these tools are built for.
The third layer, the one that turns trace data into a deflection rate or cost-per-resolution figure your own customer can see on a white-labeled dashboard scoped to just their account, is where most general observability tooling stops short, because it’s solving a different problem for a different audience. This is the layer AiAgRe’s SDK sits on top of: it ingests the same trace events your instrumentation already produces, whatever framework generated them, and turns them into the tenant-scoped, customer-facing metrics and embeddable dashboard components covered in the sections above, instead of asking you to build a second reporting pipeline by hand once the engineering-side tracing already works.
Start with one trace this week
Pick your agent’s single most common task and instrument just that path first: the model calls, the tool calls, and one session identifier tying multi-turn conversations together. Confirm you can answer, from the trace alone, which exact step caused a specific bad outcome you already know happened, because that one test tells you more about whether your instrumentation actually works than any dashboard will. Once that’s solid, add the four core metrics from the section above, tag every event with tenant identity at the point of capture rather than bolting it on later, and set your first alert as a rolling baseline instead of a fixed number you’ll end up re-tuning by hand every few weeks.
None of this needs a large observability team or a six-month rollout. It needs one well-traced task, four metrics computed the same way for engineers and customers alike, and a tenant boundary that gets tested rather than assumed. If you’re building the kind of AI product where your own customers will eventually look at the deflection rate and cost-per-resolution numbers your agent produces, AiAgRe ingests that same trace data and turns it into the white-label, tenant-scoped dashboard your customers see, so the tracing work above and the number your customer trusts end up coming from the same evidence.
Frequently asked questions
What is AI agent observability?
AI agent observability is the practice of capturing every model call, tool call, and retrieval step an agent makes in production as a structured trace, broken into spans, so you can inspect exactly what happened behind any given reply instead of trusting the final message on its own.
What is the difference between AI agent observability and AI agent monitoring?
Monitoring generally refers to watching an agent’s metrics and traces in production to catch problems as they happen, while observability is the underlying instrumentation, the traces and spans, that makes that watching possible in the first place. In practice the two terms overlap heavily, and monitoring is best thought of as what you do once observability data actually exists to look at.
Do you need OpenTelemetry to trace an AI agent?
Not strictly, but it’s worth adopting early. OpenTelemetry is an open, vendor-neutral standard for capturing traces and spans, and most agent frameworks, including LangChain, LlamaIndex, and CrewAI, now support it natively or through a wrapper, so instrumenting against it keeps you from getting locked into one tracing backend.
How do you make agent traces customer-facing instead of only internal?
Compute the customer-facing metric from the same trace data your engineering team already uses, tag every event with the tenant it belongs to at the point of capture, and render it scoped to that tenant only, so the number a customer sees and the number an engineer would compute from the raw trace always agree.
What should trigger an alert on an AI agent’s metrics?
A sustained move away from that metric’s own recent baseline, not a single fixed number chosen in advance. Track the trailing one to two weeks of normal range for each metric and alert when a new reading moves meaningfully outside it across enough conversations to rule out one noisy sample, with a tighter, faster threshold for tool-call errors than for slower-moving metrics like cost per resolution.
Can one customer see another customer’s agent traces in a multi-tenant product?
Not if tenant identity is tagged at the point traces are captured rather than filtered out afterward in the display layer. Test this directly: run traces under two fake tenants, then deliberately request one tenant’s data using credentials scoped to the other, and confirm it fails cleanly instead of returning the wrong rows.
Related reading: AI agent testing covers the failure modes that quietly corrupt the traces this piece is about, AI agent hallucination covers the false-completion pattern a trace has to catch, context rot in AI agents covers the long-session degradation that shows up in exactly the multi-turn traces this piece describes, deflection rate, explained is the customer-facing metric your trace data ultimately has to produce, AI agent monitoring is what watches these same signals continuously once instrumentation is in place, and AI agent observability tools covers the checklist for choosing a platform to run that instrumentation on once your agent has its own paying customers. See pricing for how AiAgRe’s tracing and white-label dashboards fit together.